The five major risk indicators have not shown reversal signals: AI-driven bull market in US stocks continues.


The five major trends remain unbroken, coupled with the strong support of the capital influx of AI computing power, all indicating one thing to the market: the global stock market bull market momentum is still strong.

Trend indicators evaluating the risk outlook show that global stock markets have recently experienced a brief decline, especially the relative weakness in the US stock market, which seems more like a short-term pullback noise in the long-term bull market phase rather than a complete market reversal stage. One core trend indicator indicates that defensive sectors and value stocks have yet to outperform the broader blue-chip stocks and technology giants closely related to AI included in the S&P 500 index, implying that there is still significant room for the continuation of the US stock bull market trend driven by the AI investment frenzy.
Since September, the "Century Alliance" between NVIDIA and long-time competitor Intel, as well as OpenAI signing billion-dollar level AI computational power infrastructure superorders with technology leaders like Oracle, NVIDIA, AMD, and Broadcom, have raised concerns among some Wall Street analysts that this unusual "cyclical financing" may lead to an inflation of the AI bubble and eventually trigger a prolonged bear market in the stock market comparable to the period after the "dot-com bubble." However, multiple risk assessment indicators show that the momentum of the US stock bull market remains strong, and a substantial reversal of the bull market is unlikely to occur.
Furthermore, according to market analysts at Goldman Sachs, although the valuation of the technology sector in the US stock market has increased, it has not reached historical bubble levels. Goldman Sachs points out that the rise in technology stocks is mainly driven by the fundamental growth of technology weight stocks, rather than the irrational speculative frenzy contributed by a large number of unprofitable companies as seen during the dot-com bubble era, especially leading AI companies like NVIDIA and Google have exceptionally strong balance sheets, which is a key difference compared to past bubble periods.
The logic of AI computational power surpasses short-term noise, and the core logic of the bull market remains dominant.
Goldman Sachs analysts emphasize that this wave of AI investment frenzy is still in its "early stages," primarily based on the practical deployment of AI applications like ChatGPT and Claude in the corporate scene which has already brought productivity and operational efficiency improvements (for example, AI deployment is just beginning within institutions like Goldman Sachs). To achieve these improvements, an immensely large infrastructure of AI computational power is required. "The potential enormous economic value promised by generative AI makes the massive investments in AI infrastructure by global companies rational," the analysts from Goldman Sachs wrote.
Since 2023, the long-term bull market narrative driven by the unprecedented AI investment frenzy continues. With the seven tech giants dominating the high-weight US stocks and the increasing weight of technology stocks in the global stock market reaching new highs, it appears that the AI-driven global stock market bull market is still ongoing based on various core trend indicators and news dynamics related to the AI bull market.
Recent significant increases in the prices of high-performance storage products in the global DRAM and NAND series, along with the over 1 trillion USD level AI computational power infrastructure deal sealed by the world's highest valued AI startup, OpenAI, and the leading chip manufacturer TSMC's announcement of extraordinary performance and an upward adjustment of its 2025 revenue growth expectation to 30% range, further strengthen the narrative logic of the "long-term bull market" in the AI computational power infrastructure sector.
With the earnings season in the stock market underway, the stellar performance of TSMC and ASML undoubtedly reinforces the narrative logic of the "long-term bull market in AI" and the "AI investment belief" of tech stock enthusiasts, indicating that the current "super bull market trend" led by NVIDIA, TSMC, Broadcom, and Micron Technology dominating the global AI computational power industry chain is far from over, and this industry chain will remain one of the most favored investment sectors in the near future.
In the view of top Wall Street institutions such as Cantor Fitzgerald, HSBC, and Morgan Stanley, NVIDIA is still expected to be the core beneficiary of the trillion-dollar wave of AI spending, which is why Cantor and HSBC have significantly raised their target stock price for NVIDIA recently. It is reported that the financial giant HSBC has upgraded NVIDIA's stock rating from "hold" to "buy," strongly countering the prevalent "AI bubble theory" in the market. Even more significantly, HSBC has raised its target stock price for NVIDIA from $200 to $320, which is the highest level on Wall Street.
The new target set by HSBC indicates that NVIDIA, the world's largest market capitalization company, still has up to 80% significant upside potential in its stock price. If this target is achieved, NVIDIA's market capitalization would reach an astonishing approximately $8 trillion, while NVIDIA's current market capitalization is around $4.40 trillion, maintaining the top position on the global market value rankings for a long time. NVIDIA's stock price has seen multiple new highs this year, with a rise of up to 40% year-to-date until 2025.
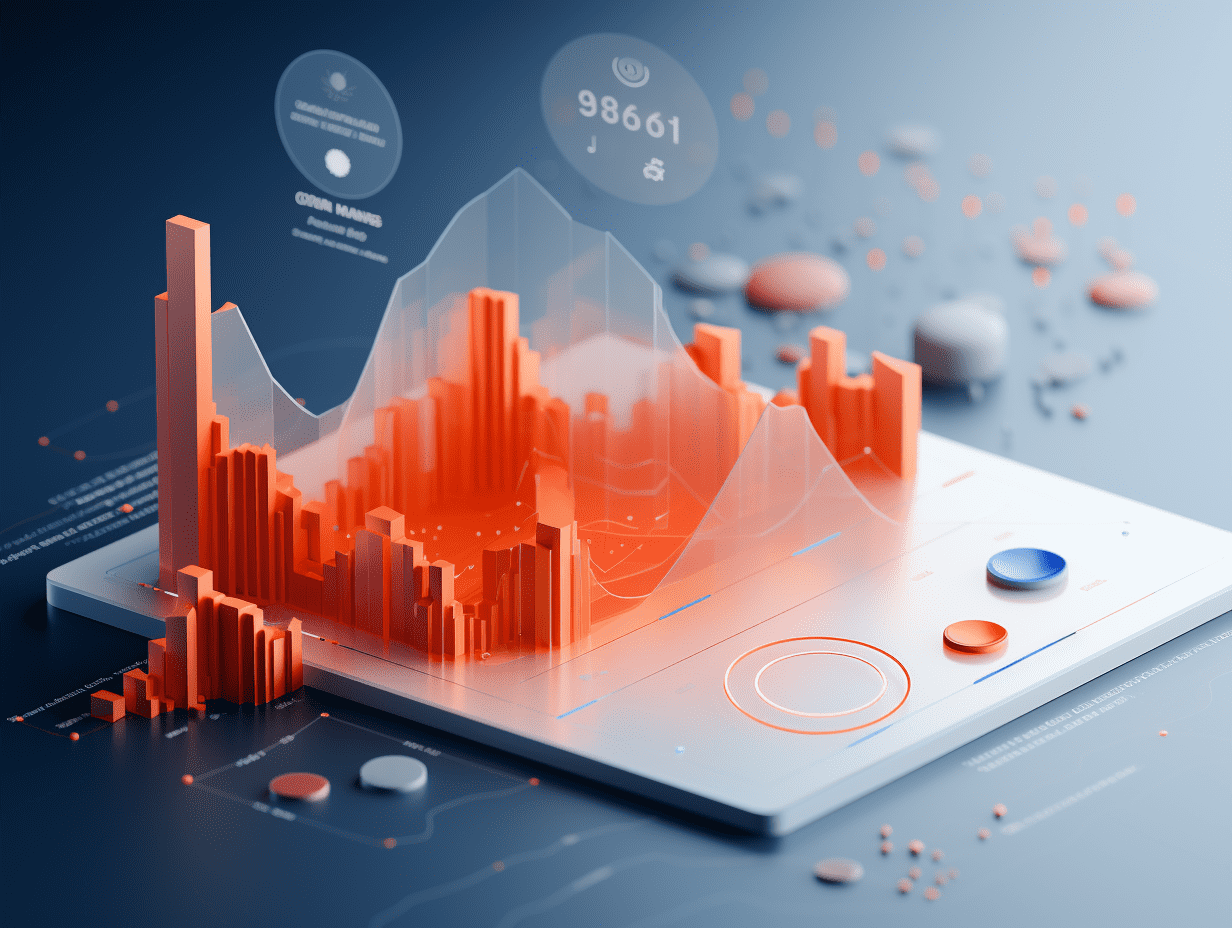
Five key trend indicators to determine whether the stock market bull market is in the process of collapsing
Using a set of trend indicators to filter market behavior can provide a relatively objective perspective to counteract the impulse of making asset allocation decisions or speculative expectations driven by daily news headlines.
There are many ways to describe market trends. The following five market portraits (based on the trends of tracked ETFs) serve as a practical starting point for "quantitative risk assessment" of stock market short-term risk preferences.
All common warning indicators are suitable for judging market trends or investment sentiments. The underlying logic of the analysis based on the following five indicators shows that, until there is convincing evidence that the main trend is reversing, it can be assumed that the current market trend is likely to continue, implying that the prolonged bull market in US stocks since 2023 is still in a positive state and on a bullish trajectory.
S&P 500 Index Weekly Trend
Starting with a widely accepted "broad-based" measure indicator - the S&P 500 Index ETF (SPDR S&P 500 ETF, ticker: SPY), to review the overall stock market. To reduce noise, weekly statistical data is used here (and in the following sections). Despite the alarming news headlines following last Friday's market sell-off, the retreat on a weekly level is still very mild, falling within the range of historical normal fluctuations.
While the S&P 500 Index ETF has dropped below its 5-week moving average, this is considered a typical fluctuation event, not signaling a long-term bear market decline. A more concerning signal would occur in a pessimistic scenario: if the 5-week trend line (black line in the chart below) falls below the 20-week moving average (green line), it would indicate a significant downward shift in market sentiment with a notable switch to selling. However, currently, such a change in direction or shift in sentiment is not imminent.
Consumer Staples Sector Relative to Market Trend
As a key check indicator for assessing the bearish/bullish sentiment of the overall stock market and benchmark index - the S&P 500 Index, comparing the overall trend of consumer staples sector stocks (ETF ticker: XLP) relative to the US stock market large-cap (SPY) signals is quite valuable. During periods of increased market pressure, consumer staples stocks tend to outperform the overall market as investors start seeking relatively safer market havens.
In investment stages where there is a preference for lower-risk assets, this ratio (red line in the chart below) tends to rise significantly. However, as the latest data shows, the consumer staples ETF continues to significantly lag behind the US stock market large-cap (SPY), consistent with the previously mentioned weekly trend of the S&P 500.
Value vs. Growth
Another key check for assessing the bullish/bearish trend of the S&P 500 Index is observing the performance of the largest-scale value stocks ETF (ticker: VTV) relative to the growth stocks ETF (ticker: VUG). Corresponding to the historical pattern observed in the comparison of consumer staples to the S&P 500 Index, during periods of market volatility and pressure rise, value stocks tend to significantly outperform growth stocks - meaning the VTV-VUG ratio shows a substantial upward trend.
Although the 2022 global stock market experienced a significant decline due to the Fed's aggressive interest rate hike cycle, recent data indicates that the market's pursuit sentiment for technology stocks benefiting from the unprecedented AI investment frenzy remains strong. This is reflected in the continuous significant lagging of the value stocks attribute ETF (VTV) compared to the growth-focused ETF (VUG) concentrated on technology stocks closely related to AI, providing another important clue for the core judgment that the "main trend of the broad stock market has not yet faltered."
It is due to the epic stock price increases of leading tech giants NVIDIA, Meta, Google, Oracle, TSMC, Broadcom, and other big tech companies, as well as the extraordinary strong performance and continued robust performance this year, that a unprecedented wave of AI investment has swept the US stock market and global stock market, propelling the S&P 500 Index and the MSCI Global Index, which measures the global stock market, to significant highs since the yearly low in April, continuously setting historical highs.
Analysts from Cantor Fitzgerald's team state that the rapid and extremely widespread deployment of generative AI applications prove that this wave of AI is not a bubble in any sense. "In the past 12 months, large-scale recommendation systems worldwide have adopted generative AI. For example, search has migrated to generative AI. Social media has migrated to generative AI." "Users generate innovative content independently, AI-based advertising recommendation engines, everything has shifted from traditional machine learning to generative AI. Just the massive migration from traditional computing to generative AI, NVIDIA has seen capital expenditures of up to $2 trillion. We are absolutely not in a bubble. On the contrary, the market is starting to recognize how 'high-quality' AI can bring significantly positive investment returns." Cantor Fitzgerald wrote in a bullish report for NVIDIA.
Low Volatility Stocks vs. S&P 500 Index
Another window to evaluate the main trend of the market is to compare the overall performance of low volatility stocks (ETF ticker: USMV) with the S&P 500 Index ETF (SPY). Low volatility stocks are considered a defensive subset force in the market, as they tend to outperform the broader market during periods of market pressure and cautious investor sentiment. Periods when low volatility stocks significantly rise are usually accompanied by a sharp decline in risk appetite in the market and lead to an extended period of selling pressure, marking a pessimistic bear market period.
During the prolonged selling phase, the USMV-SPY ratio will significantly rise. However, what we see here is a completely different deduction: the ratio continues to decline, indicating that this market sentiment measure has not given any meaningful signals of a bullish sentiment breaking down or turning point.
Commodities vs. S&P 500 Index
Lastly, we focus on the performance of commodities (benchmark ETF ticker: GSG) relative to the stock market (SPY). Given the recent concerns about "tariffs or inflation acceleration," this ratio is a timely proxy indicator to gauge market concerns on this issue.
During the period of significant inflation in 2022, the commodity ETF GSG significantly outperformed the S&P 500 Index ETF, as shown by the significant upward trend in this ratio in the chart below. However, in contrast, the ratio has been declining in recent months, suggesting that while the market has raised concerns about inflation, it is still relatively moderate compared to historical data, thus not posing an imminent threat to the strong bullish trajectory of the stock market.
It is worth noting that the underlying logic of the above analysis framework can certainly change, and will do so at some point. However, the current investment perspective indicates that the stock market's bullish upward trend remains intact. For a convincing claim that the upward trend has peaked, the stock market will need to deteriorate significantly further, and the indicators focusing on cautious sentiment and selling pressure must have strong momentum to outperform the S&P 500 Index.
No one knows exactly when the tipping point will occur, but these core trend charts suggest that the probability of the market reaching a peak or near a turning point remains very low. When there is a significant shift in global stock market risk preferences, we are likely to see important new evidence regarding the bull market turning point or the start of a bear market in the above indicators.
Related Articles
Traditional record industry welcomes "Disruptor"? AI music production unicorn Suno plans to raise over $1 billion in funding, with a valuation of $20 billion.

"Golden flag bearer" Dario "increases firepower": Gold is the only "everlasting, universal" currency that does not rely on others.

Philadelphia Fed: credit tightening affects US consumption, spending decreases for low credit score people.
Traditional record industry welcomes "Disruptor"? AI music production unicorn Suno plans to raise over $1 billion in funding, with a valuation of $20 billion.
"Golden flag bearer" Dario "increases firepower": Gold is the only "everlasting, universal" currency that does not rely on others.
Philadelphia Fed: credit tightening affects US consumption, spending decreases for low credit score people.
RECOMMEND